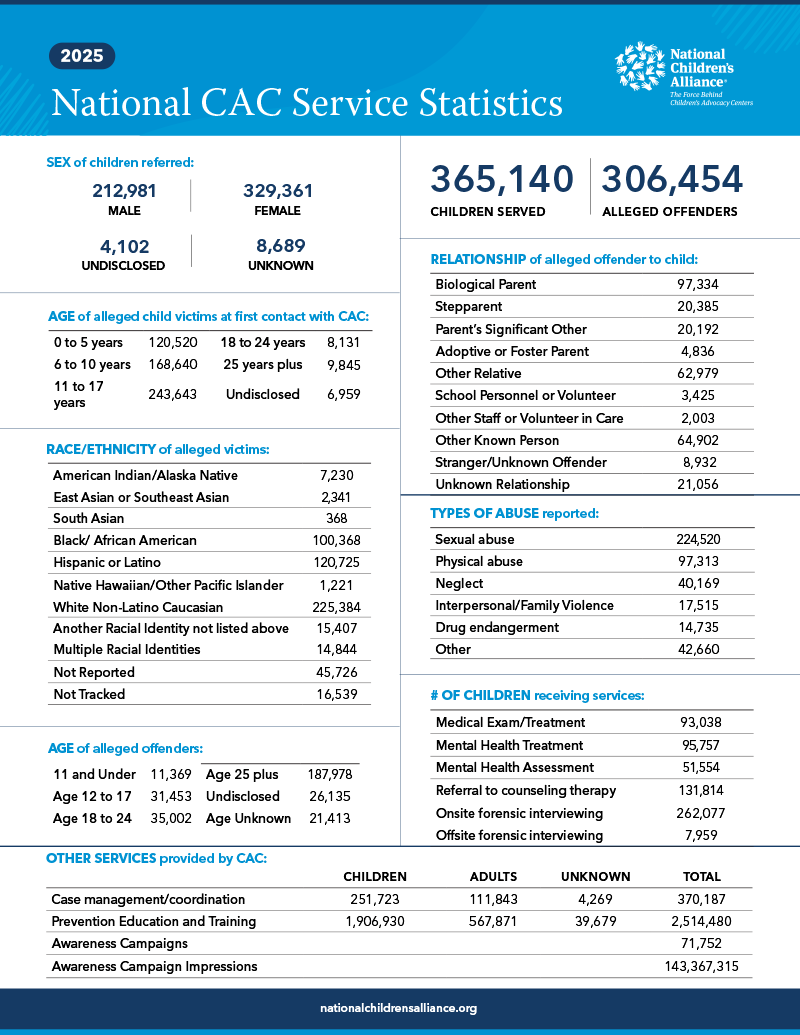
CAC Statistics

Children’s Advocacy Centers offer high-quality care to help children heal from the trauma of abuse. Below you can find out more about the work done by NCA’s Member CACs last year: the total number of children served, the types of abuse those children experienced, client demographics, the types of services CACs provided, and more. You can browse the data by state, by region, or nationally. CACs submit data to NCA twice a year.

Access CAC statistics from past years to compare and identify trends:

2021 CAC Statistics2020 2019 | 2018 | 2017 | 2016 | 2015 | 2014 | 2013

For information about child abuse in general—the scope of the problem, and how it impacts kids—see our information on National Statistics on Child Abuse.

2022 CAC Statistics

National

Midwest

Northeast

Southern

Western

Alabama

Alaska

Arizona

Arkansas

California

Colorado

Connecticut

Delaware

District of Columbia

Florida

Georgia

Hawaii

Idaho

Illinois

Indiana

Iowa

Kansas

Kentucky

Louisiana

Maine

Maryland

Massachusetts

Michigan

Minnesota

Mississippi

Missouri

Montana

Nebraska

Nevada

New Hampshire

New Jersey

New Mexico

New York

North Carolina

North Dakota

Ohio

Oklahoma

Oregon

Pennsylvania

Rhode Island

South Carolina

South Dakota

Tennessee

Texas

Utah

Vermont

Virginia

Washington

West Virginia

Wisconsin

Wyoming

Access CAC statistics from past years:

2021 CAC Statistics

2020 CAC Statistics

2019 CAC Statistics

2018 CAC Statistics

2017 CAC Statistics

2016 CAC Statistics

2015 CAC Statistics

2014 CAC Statistics

2013 CAC Statistics

Looking for Help?

Find an NCA member location